Governance by those who do the work.

Sunday, October 2, 2016

Mixed Convection from a Rough Plate

Its been a long time since my last blog entry; there are new developments.

After completing the vertical convection measurements, I returned the Convection Machine to its horizontal orientation and did some runs to make sure everything was as before.  But things were not the same.

With the rough side facing down, the transition where mixed convection dropped below the linear asymptote had disappeared.  Varying parameters did not restore the dip.  Changing inclination of the plate; tilting the wind-tunnel; resealing the cardboard around the fan; nothing I tried restored the dip.  Something has permanently changed in the wind-tunnel or the plate.

So I reran the measurements of horizontal upward and downward facing mixed convection.  The new curves match simple L2 and L4 norms of the forced and natural convection components.  My guess of what changed has to do with the suspension of the plate.  The vertical suspension was a single long wire which, after hooking around the a top corner post, wrapped across the back and hooked around the other top corner post.  Wrapping around the back compressed the back sheet and insulation against the back side of the rough plate.  Perhaps the pressure closed gaps in the glue between aluminum and insulation.

Having data for horizontal forced flow with 3 plate orientations, it was time to measure downward forced flow with a vertical plate. Because vibration of the plate had caused excess convection with the single wire suspension, I added two wrap-around wires pulling in opposite directions to the plate suspension.  This new suspension is quite rigid and works with the wind-tunnel in any orientation.

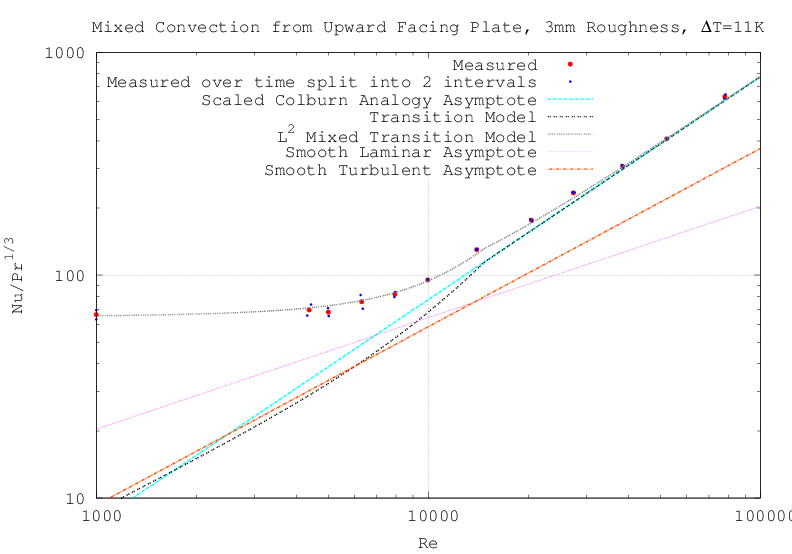
I added four legs to support the wind-tunnel upright with the fan drawing downward.  I was expecting either L2-norm mixing or for convection to drop below the natural level when the natural and forced components were equal.  But it was neither!  I devised a model which transitions between L2 and L4 norm that matched the measurements well; it is detailed in my paper.

Because the opposed mixing was unexpected, aided mixing had to be tried.  It also turned out to involve a transition between L2 and L4 norms, but with a gentler transition.

I have finished writing the article and put it and the supplementary data on http://people.csail.mit.edu/jaffer/convect

As described in the paper, the next step is to shave 4.mm off the rough side of the plate and repeat the measurements.

Monday, June 13, 2016

Mixed Convection from a Vertical Rough Surface

I turned the wind-tunnel on its side and hung the plate vertically as shown in the photograph.


These graphs show that my mixed convection model is successful from natural through forced convection for horizontal and vertical rough plates with forced flow perpendicular to the natural flow.  The leftmost red dot in each graph is the natural convection (Re=0) for that orientation; it is placed at Re=1000 so that it can appear on the graph.


The L4-norm for downward convection indicates that the interaction between the downward mode and forced convection is more competitive than the fairly cooperative L2-norm of the vertical and upward modes.

Horizontal downward and vertical natural convection from the rough plate match that expected from a smooth plate.  Horizontal upward convection matches assuming that the upper (rough) surface convection is reduced by 93% of the non-forced convection from the four adjoining sides.  In order to test if horizontal upward convection is the same for rough and smooth, I will cover the rough surface with a flat sheet of aluminum and repeat the test.

I have started writing a paper titled "Mixed Convection from a Rough Plate".  Which journal should I submit it to?

Saturday, June 4, 2016

Fan Windspeed

With the wind-tunnel fan being phase-locked now, the speed variability which plagued earlier speed measurements should be reduced or eliminated.

The process of conducting the measurements for these graphs finds this to be the case.  Although some variability remains above 3 m/s (1000 r/min), at slower speeds the anemometer readings are steady after the phase-lock-loop settles.  The measured traces are in blue; the black curve is that used in convection calculations.  This first graph is for the wind tunnel with horizontal plate.


This second graph is with the wind tunnel laying on its side with the plate vertical.


An earlier post found that the kink just above 2 m/s is due to the anemometer; it remains.  Friction in the anemometer makes the measurements below fan speeds of 700 r/min unreliable; below fan speeds of 200 r/min the anemometer reads 0.0.

Saturday, May 7, 2016

How to Phase-Lock a Fan

Using an auto-transformer to reduce the voltage to the wind-tunnel fan
in order to reduce its speed didn't work below 45 r/min (it ran for a
while and stopped).  So I modified The Convection Machine to toggle
the fan power with a solid-state relay controlled by micro-processor.

Consider the shaft of the wind-tunnel fan.  Every full rotation of the
fan results in 3 micro-processor interrupts.  A phase-accumulator
register is incremented by the desired rotation rate (in r/min) 1200
times a second and decreased by 24000 every time a fan blade crosses a
light beam.  If the fan rotates at the desired rotation rate, then the
average phase-accumulator value is constant.  If the fan is too slow,
then the phase-accumulator value increases with time; if it is too
fast, then the phase-accumulator value decreases with time.

Phase-locking is the process of controlling the fan-speed so that the
average phase-accumulator value is 0.  Such feedback systems are
tricky to stabilize.  My fan controller operates in one mode when the
desired speed is less than 400 r/min and a different one otherwise.

At high speeds, the fan speed is roughly proportional to the average
voltage applied, which is proportional to the duty cycle of applied
voltage.  The phase accumulator operates as described above.  Its
instantaneous value is compared with a variable which decrements from
the upper phase range bound to 0 ten times a second.  If greater, the
fan is turned on, otherwise it is turned off.  Some of the
instabilities of the fan speed may be due to a centripetal switch
disconnecting the starter capacitor and hooking in the running
capacitor, which increases the loop gain of the system.  The change in
gain causes the system to overshoot and undershoot the desired r/min
with long settling times.

At low speeds each pulse of power incrementally increases the fan
speed while friction continually slows it.  The solid-state relay has
"zero-crossing" control, so only complete half-cycles of 60 Hz power
are applied to the fan motor.  The combination of the motor windings
and phase capacitor stores energy, so the acceleration of the rotor is
delayed from the application of power.  At low speeds the rotational
inertia of the rotor introduces 90 degrees of phase shift.  The
microprocessor clock is not synchronized to the line voltage, so the
minimum pulse width varies with the relative phase, another source of
loop gain variation.


This photo shows the new fan-speed control.  The number on the
7-segment displays is the rotation rate in r/min measured every
second.  The right 3 dial switches set the desired rotation rate.


This video which shows the phased-locked fan in
operation at a variety of speeds.  The low light level was necessary
so that the stroboscopic interaction of camera shutter with the
scanned 7-segment display didn't render the numbers unreadable.  If
you turn up the audio volume you can hear the fan chugging as its
power is switched on and off.

Saturday, March 19, 2016

Make Square Opening by Drilling Five Round Holes

In making a speed control for an off-the-shelf electric fan, I needed to install a square power receptacle in the phenolic box I am using for the speed dial switches and 7-segment displays.  Phenolic is brittle and does not machine well with the woodworking tools that I have, chipping instead of cutting.

A straightforward way to cut the hole would be to drill a hole, disassemble a coping saw and reassemble it with the blade through the hole, and sawing.  But the small size of the box would limit the saw strokes to a few centimetres.

A reciprocating "Sabre" saw might do the job but is hard to control.

Twist drill bits seemed to work the best of my tools on the material, and I have a good selection of sizes.  How close to a square opening can one create by drilling a small number of round holes?  It turns out that I can come fairly close.  There are two ways the problem can be posed, the largest opening bounded within the square or the smallest opening just larger than the square.  I am interested in the latter; the other solution can be had by scaling.

The idea is to drill holes on the diagonals near the 4 corners such that the corner touches the rim of the hole.  One then drills a hole in the center which is enough larger than the square so that its points of contact with the square are points of contact with the 4 smaller holes.  If the diameter of the 4 corner holes is reduced, then the diameter of the center hole must be increased in order for it to intersect the smaller holes and the square.

Let L be the length of one side of the square, R be the radius of the center hole, and r be the radius of the corner holes.  The center of each corner hole is L/sqrt(2)-r from the center of the square so that the rim lies on the corner point.  The furthest that the corner holes exceed the desired square is

  r+(L/sqrt(2)-r)/sqrt(2)-L/2 = r-r/sqrt(2) = r*(1-sqrt(1/2))

The furthest that the large center hole exceeds the desired square is R-L/2.  Desired is:

  R-L/2 = r*(1-sqrt(1/2))

The other constraint is that the rim of the center hole and the rim of the corner hole intersect on the side of the square.  The distance from the middle of the side to the intersection of the side with the large hole is x

  R^2 = (L/2)^2 + x^2

The distance from the corner to the intersection is r*sqrt(2).  So:

  L/2 = r*sqrt(2) + x

R, r, and x scale with L.  Let L = 1.

  R^2 = 1/4 + x^2

  1/2 = r*sqrt(2) + x

  R-1/2 = r*(1-sqrt(1/2))


Solving this system:

  r = 1/(4+sqrt(2))

  r = L * 184.69903125906464e-3

  R = L * 554.097093777194e-3

The diameters when L = 1.125 are:

  d = 415.57282033289544e-3

  D = 1.2467184609986863

I made the holes with a 3/8 inch twist drill and a 1.25 inch hole saw.  A 7/16 bit  would have been closer in size.

The flange on the outlet covers the non-square parts of opening.

Thursday, February 18, 2016

Vertical Natural Convection

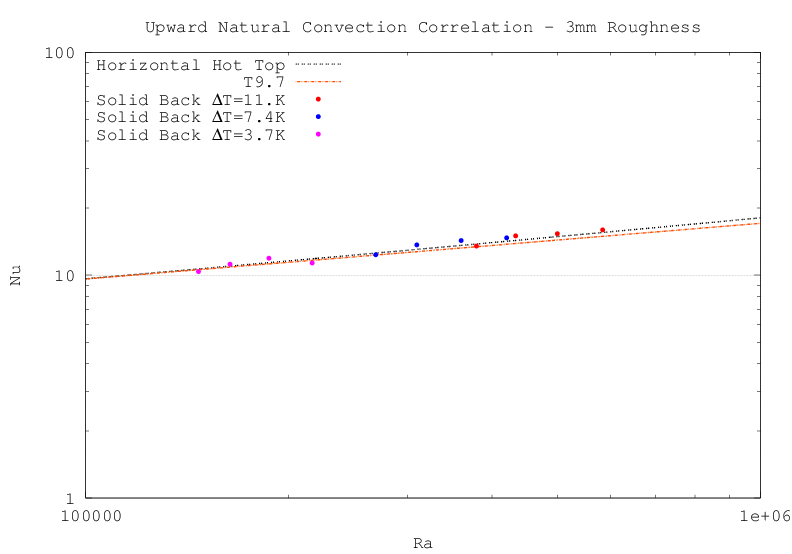
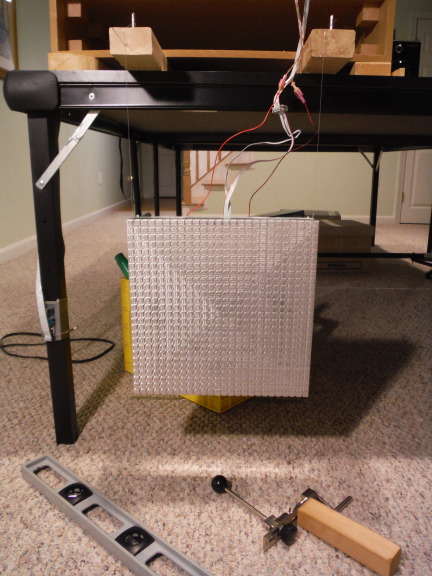
Unexpected results for downward convection at small-angles raised the question of whether vertical natural convection is the same for rough and smooth plates. This photo shows the plate suspended vertically by steel wire from the two boards above. The ambient temperature sensor is taped to the table leg. I measured the natural convection over three temperature ranges as was done in the other natural convection runs.
If there is less convection than expected, then it could be due to heat from one side reducing the convection of a side above it, as happens in the upward facing case.
But slightly more convection than expected was measured. As the plate is no longer in the wind tunnel, modeling the emissivity of the room as 0.9 (versus 0.8 for the wind tunnel) brings the simulation into reasonable agreement with measurement. It thus appears that, at least for laminar flows from rectangular plates, natural convection from a rough surface has the same magnitude as convection from a smooth surface.
The graph below is linked to a pdf of the measurements and simulations of natural convection in level and vertical orientations.
natural vertical convection correlation

Saturday, February 6, 2016

Mixed Convection

As my blog post Upward Natural Convection details, there is no guarantee that natural convection of my plate with the rough surface facing up behaves in a manner which can be modeled. The air warmed by the insulated back and sides rises adjacent to the heated rough surface which draws air towards its center. So how strong is this effect? Measured with peak temperature differences of 15 K, 10 K, and 5 K, the measured upward natural convection is about half that predicted. But looking at the natural convection components, the deficit is roughly equal to sum of the back and side convective heat flows!
With the rough surface facing down, the mix of convective and radiative heat loss from the four sides matters little because both are subtracted from the overall heat loss. But when the rough surface faces upward it does matter; side convection reduces the rough surface convection while thermal radiation does not. Creating a plot of downward natural convection at a range of temperature differences allows evaluation of simulated mixtures. As the fraction of simulated radiative heat loss increases, the slope connecting the measured points increases. The graph below shows the fit when the effective radiative height of the side is 41% of its actual height, and the effective convective surface area is adjusted to fit:
Downward Natural Convection
With this rough estimate of the relative strengths of convective and radiative heat loss, we are now ready to see whether the effect of the sides on the top surface can be reasonably modeled.
The plot below compares upward convection correlations with total non-radiative heat flow minus 77% of the (modeled) sides and back natural convection. There is less variation from point to point because upward natural convection is three times stronger than downward natural convection. "Horizontal Hot Top" is my generalization of the four conventional upward convection correlations.
Upward Natural Convection
The unexpectedly close match above lends support to the idea that air heated by the sides is drawn over the upper surface of the plate, reducing the effective temperature difference between the plate and air, and can be modeled as a reduction of upward convection by an amount proportional to the side convection.
Now that I have convection measurements at low fan speeds which are comparable in magnitude to natural convection, the next step is to evaluate mixed convection (with the rough surface facing upward).
Just as there was no guarantee of a workable model for the interaction of the sides with the top in still air, there is no guarantee of a model of that interaction in forced air. Needed is a generalization matches the model developed for V=0 and matches the forced correlation as V grows.
The graph below shows the correlation I have arrived at for upward convection (see simulations). It assumes that mixed convection for the four short sides is the L4-norm of the natural and forced convections and that 77% of only the natural component of the back and sides is absorbed by the convection of the (upward-facing) rough surface.
Forced Mixed with Upward Natural Convection
If the L4-norm mixing for the short sides is instead L2, the increase in natural convection from the sides reduces the top surface convection, spoiling the upward-convection match with L2-norm (gray dashed line) and other L-norm exponents (best is about L2.3).
Here are the calculated values of convection from all six sides of the plate at windspeeds from 0 to 4 m/s and ΔT=11K:
insulated
back
+ 2 ⋅parallel
side
+ 2 ⋅windward
leeward
=totalvsrough@windspeed
53.1mW/K
55.3mW/K
55.3mW/K
0.272W/K
0.467W/K
0.0m/s
55.2mW/K
55.4mW/K
55.4mW/K
0.274W/K
0.484W/K
0.12m/s
60.4mW/K
55.5mW/K
55.4mW/K
0.280W/K
0.520W/K
0.25m/s
65.0mW/K
55.9mW/K
55.9mW/K
0.286W/K
0.666W/K
0.50m/s
68.5mW/K
57.3mW/K
57.6mW/K
0.296W/K
1.18W/K
1.0m/s
71.0mW/K
61.5mW/K
63.4mW/K
0.318W/K
2.22W/K
2.0m/s
72.6mW/K
72.4mW/K
78.4mW/K
0.371W/K
4.36W/K
4.0m/s
I had expected L4-norm mixing for upward convection. So these results will require modifications to my theory of mixed convection.

Wednesday, January 27, 2016

Forced Convection on Convection Machine 2.0

The new back eliminated the dual modes seen earlier with peak ΔT=15K. Reducing the r/min to m/s conversion by 2% (which is within the ± 3% error band of the anemometer) and adjusting the breakpoint results in a beautiful fit!

The points at Re=3545 and Re=5231 could be following either the Smooth Turbulent Asymptote or the Transition Model; it's too close to tell. The reason that the Transition Model has less convection than the Smooth Turbulent Asymptote below Re=6000 is because the leading edge of the boundary layer is modeled as thinner than the roughness; but division by the local characteristic length, 0, is undefined at the leading edge.

Friday, January 8, 2016

Slightly Tilted Downward Convection

With the current configuration, I am measuring the natural convection from a plate inclined a few degrees from facing downward. Turning the front tuning pegs shortens the support wires and tilts the plate.

This graph shows that downward convection does not blend with other convective modes. With θ between 87° and 90° downward convection is in control; between 0° and 87° the vertical mode is dominant. I have modified the UCT3 formula in the Downward Natural Convection section with this new knowledge.
R = min(LH, LW)/2
h = k⋅max(Nu9.3(Ra(LH) cos θ)/LH , Nu45(Ra(R) sin θ)/R) 0°≤θ≤+90° UCT3
The random variation in the plot above makes it less convincing than it might be. I modified the firmware to increase the heating threshold from 5 K to 15 K, which increases the average ΔT from 3.7 K to 11 K and reduces the relative variation by about a factor of 3.


Running the tilt tests at the higher temperature difference results in markedly reduced variation as can be seen by the proximity of the half-interval measurements (black dots) to the full-interval measurements (red dots). But the slope below 87.5° clearly does not match that derived from Nu9.3, the natrual convection from a smooth vertical plate!  More about this below.
I also ran a series of forced convection trials with the 15 K peak temperature difference:

There are several things to notice about this graph. The tests where only part of the plate had roughness penetrating the boundary layer seemed to have two distinct breakpoints: Re=16666 and Re=22222. For nearly all the measurements, the half-interval measurements (black dots) are very close to the full-interval measurements (red dots). There are two which are not so close. The black dots around Re=7440 lie close to the line, indicating the wind speed change which occured partway through the run. This can be seen in the bottom panel on page 8 of the PDF. The dots at Re=8237 had the same windspeed, perhaps indicating that the system spent time in both breakpoint modes.
Below Re=7500 the measurements track a slope of turbulent convection (Re4/5). Unfortunately the wind-tunnel can't produce wind speeds below 0.25 m/s (Re=4900), so we can't see the transition to natural downward convection.

Returning to natural convection, either the natural convection from a rough vertical surface differs from that of a smooth vertical surface or the formula combining the downward and vertical convection is wrong. The former can be tested by suspending the plate vertically. I plan to do this by wrapping the wire suspending the plate around its (insulated) back. In order to protect the insulation from being cut by the wire, a sheet of aluminum should be glued to the back. I was planning to do this already in order to test upward natural convection.


Here is the back side of the plate ready to have the 0.65 mm sheet of aluminum glued to it. Notches have been cut (using the "nibbler" on the sheet) near the sheet corners to catch the wires which will suspend it.


Gluing completed.
 

Here the rough surface of the plate is facing up in the wind tunnel. But first I must rerun all the downward facing measurements.


Blog Archive